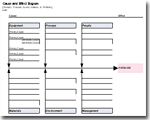
 This Fishbone Diagram, also known as a Cause and Effect Diagram or Ishikawa Diagram, was designed for ease of use. So, even though it isn't angled like most fishbone diagrams, it is much easier to edit than one that uses textboxes and arrows.
Showing posts with label Six Sigma. Show all posts
Showing posts with label Six Sigma. Show all posts
Fishbone Diagram Template
This Fishbone Diagram, also known as a Cause and Effect Diagram or Ishikawa Diagram, was designed for ease of use. So, even though it isn't angled like most fishbone diagrams, it is much easier to edit than one that uses textboxes and arrows.


PICK Chart for Lean Six Sigma

This page explains how to use a PICK Chart in a Lean Six Sigma event to help categorize process improvement ideas. You can also download a free template for recording the ideas.

Control Charts

This new Control Chart template creates X-bar, R, and S charts. Just add your data to the data table. It also calculates process capability indices (like Cp, Cpk) and percent yield, based on given specification limits.
Subscribe to:
Posts (Atom)